

Every chef watches food cost, labor and covers. Far fewer know how much of each dish guests actually eat, or how far the production plan was from real demand.
A weekly review only helps if it ends with a production planning decision for next week: what to make, how much, and when to stop cooking. These seven commercial kitchen KPIs connect what the kitchen made, what guests took and ate, and what it cost, so the chef, production lead and manager can agree on one change to cut overproduction before the next comparable service.
How to Set Up Weekly Production Planning KPIs
Start with one venue and one meal period. For each menu item, record production, food served, unserved food and where it went, plate returns and covers.
Keep prep loss and plate waste separate, use the same units every week, and note any missed scans. A lower total means little if part of service wasn't measured.
Look for patterns, not single days. One slow meal period is not a reason to rewrite a production sheet. The same item running over three or four weeks in a row is.
| KPI | What it shows | How to calculate it |
|---|---|---|
| 1. Production vs. food served | How close production is to demand, by menu item | Food served ÷ finished food produced |
| 2. Unserved food % | Overproduction, and where the surplus went | Unserved finished food ÷ finished food produced × 100 |
| 3. Plate waste per guest | Food guests took but didn't eat | Plate-return food weight ÷ covers served |
| 4. Discarded food cost per guest | Waste cost, comparable across busy and slow weeks | Ingredient cost of discarded food ÷ covers served |
| 5. Highest-cost overproduced items | Where a production change saves the most money | Quantity left over × ingredient cost per pound |
| 6. Forecast vs. actual demand | How close the plan was to reality | (Forecast portions − portions served) ÷ portions served × 100 |
| 7. Verified savings after program costs | Whether the program pays for itself | Verified gross savings − total program costs |
Food cost percentage still matters too. Use our free food cost calculator to see how much of it is food that was never served.
1. Production vs. Food Served
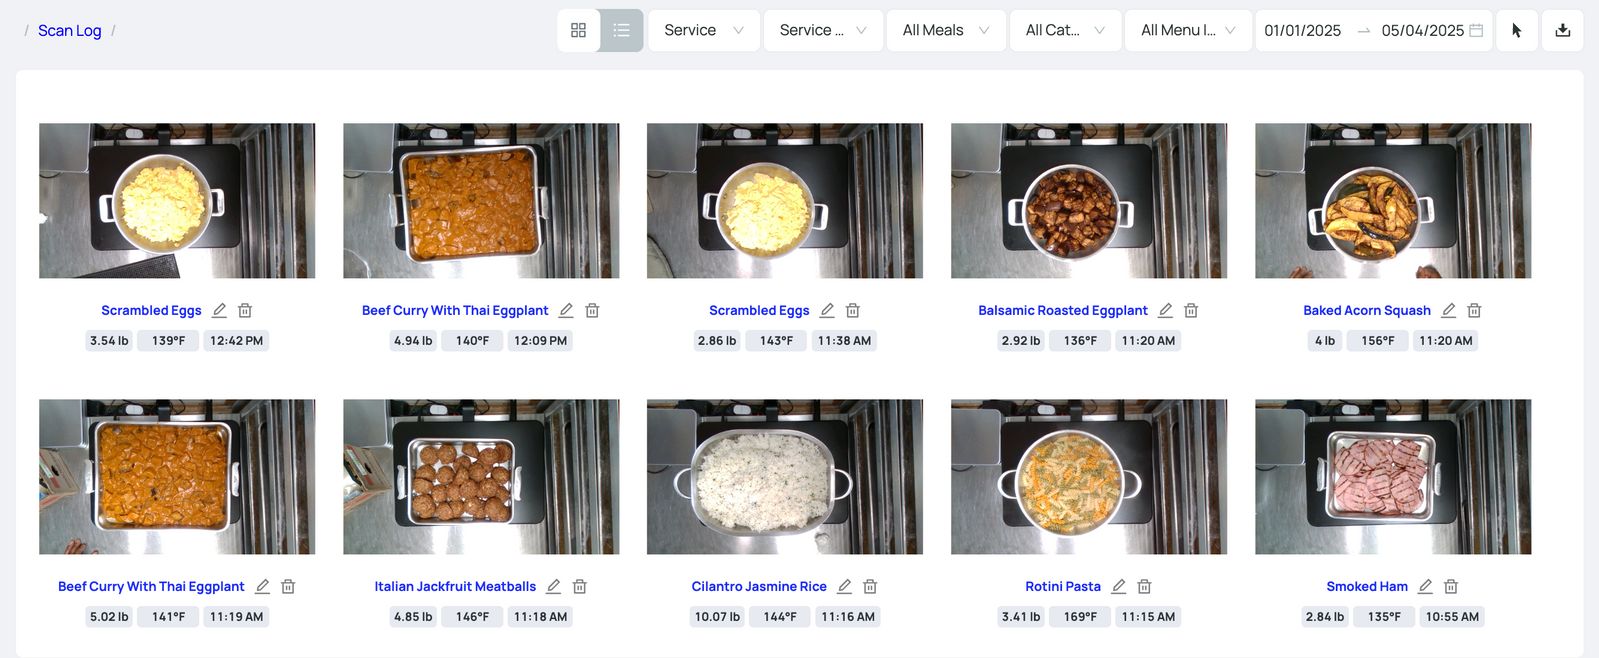
Compare the finished food produced for each menu item with the food served, in the same units. The gap is food that was held, transferred, donated, reused or thrown away, and each of those has a different fix.
A meal count tells you how many people came through for lunch. It doesn't tell you what they ate. Tracking consumption by menu item lets the kitchen plan around what guests ate the last time a dish was on the menu, rather than what the kitchen happened to make. That history feeds production quantities, purchasing and menu planning.
Food served is not the same as food eaten, which is why plate returns are tracked as a separate KPI. Record stockouts alongside this one, too. A dish that sells out early can look perfectly planned while guests who wanted it went without.
2. Unserved Food as a Share of Production
Unserved food % = unserved finished food ÷ finished food produced × 100
This is the clearest weekly signal of overproduction. It gets expensive because the kitchen has already paid to buy, prep, cook, hold and serve that food. Often a single entrée, or the last batch at dinner, accounts for most of it.
At UMass Amherst's Harvest Market, the dining team used Metafoodx production and consumption data to reduce overproduction by 51.7% over 12 weeks. Read the UMass Amherst case study.
Watch batch performance
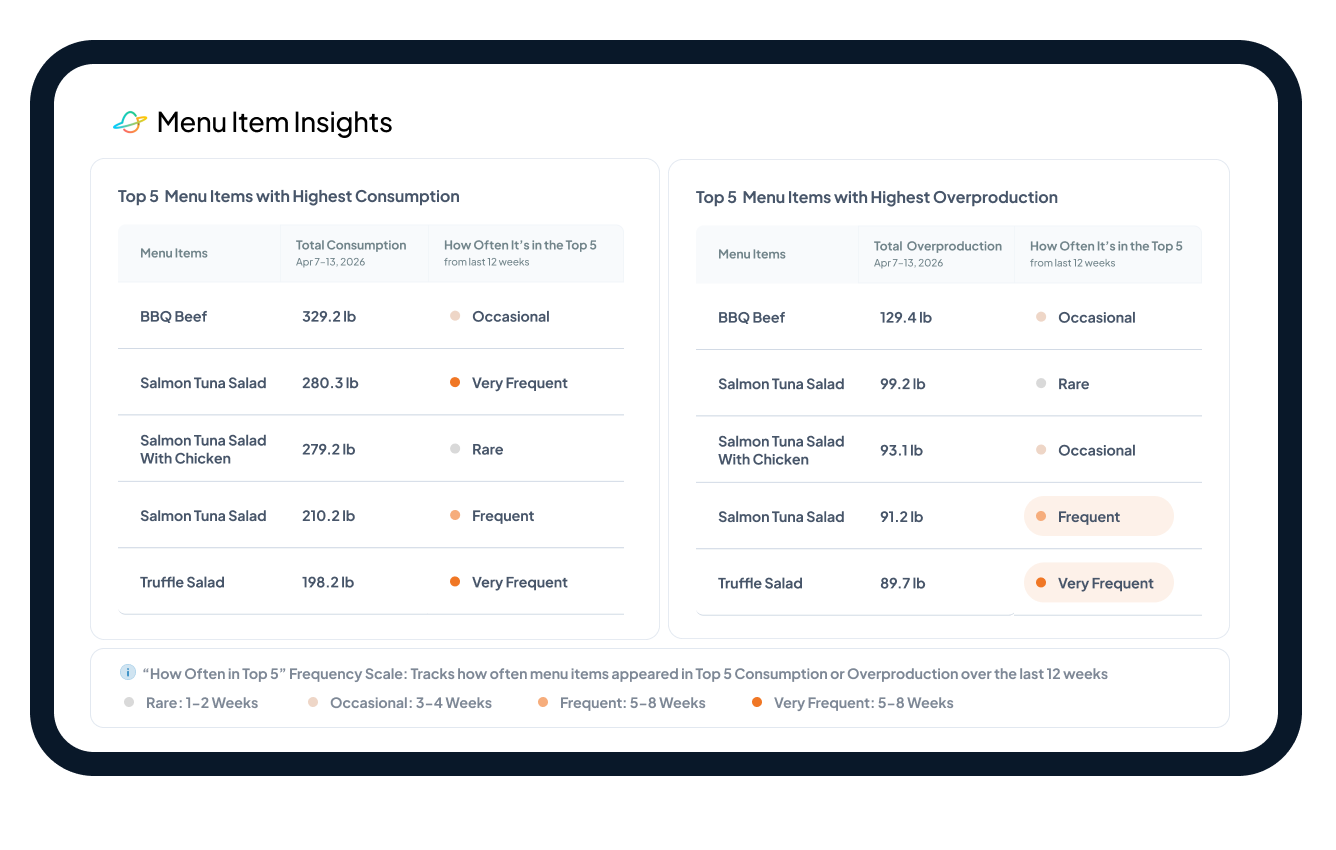
Sometimes the problem is the last batch. If a full pan goes out near the end of service and half of it comes back, send a half pan instead or wait a little longer before cooking it. For a dish that stays high week after week, test a smaller first batch with enough lead time to cook more if demand picks up.
Track where unserved food goes
Record whether leftovers are reused, donated, composted or discarded. Food that is safely reused or donated is still food the kitchen didn't need to make, but it isn't the same loss as food sent to the bin. Recovery rates and destinations also matter for sustainability reporting, especially across multiple kitchens.
Recovery doesn't fix production, though. If the same entrée is donated every Thursday, the donation program may be working perfectly while the production number is still too high. The simplest question for the chef is: what keeps coming back?

3. Plate Waste per Guest
Plate waste per guest = plate-return food weight ÷ covers served
Plate waste tells you what production numbers can't: whether guests took more than they wanted or didn't like what they took. Measure it in one consistent collection area and leave out plates, cutlery and packaging. If only some diners are measured, report the sample size with the result.
When plate waste rises on an item, look at portion size, serving utensils and recipe acceptance, and ask the line staff what guests are saying. The scan tells you which item came back. Your team tells you why.
4. Discarded Food Cost per Guest
Discarded food cost per guest = ingredient cost of discarded food ÷ covers served
Pounds alone can mislead when attendance changes. Cost per guest lets you compare a busy week with a slow one. Cost each item from the same recipe or ingredient-cost basis every week, and never use menu price as the cost of waste.
5. Highest-Cost Overproduced Items
Rank menu items by the quantity left over multiplied by their ingredient cost per pound. A few pounds of salmon or beef short rib can cost more than a full pan of rice, so this list often points somewhere different from a list sorted by weight.
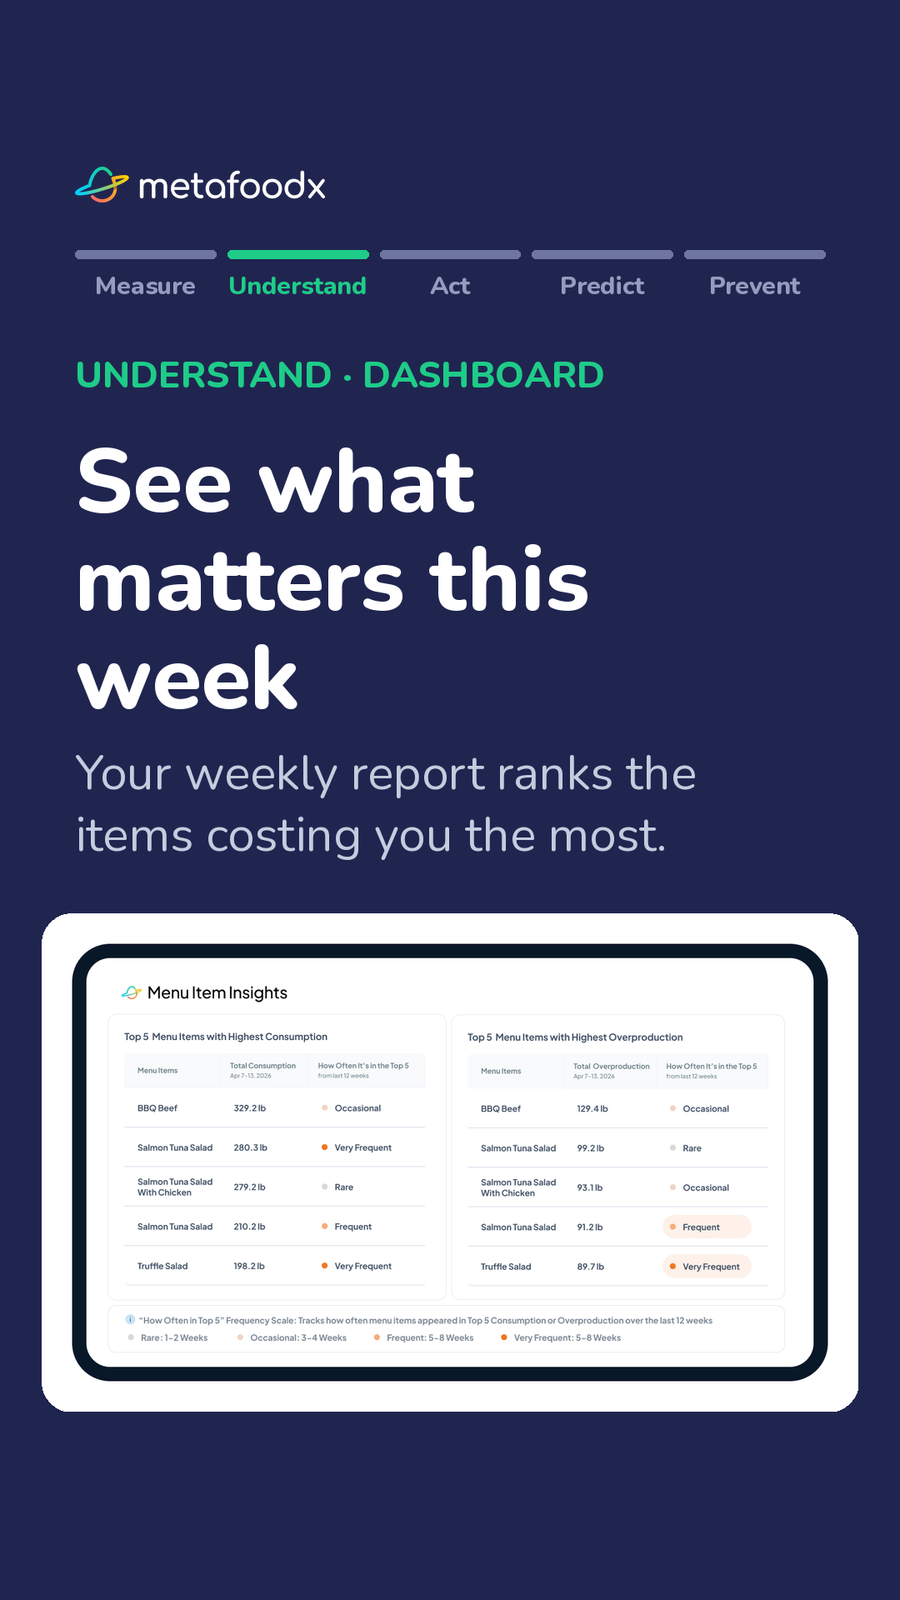
Metafoodx's weekly report ranks the five overproduced items costing each venue the most, using actual or estimated cost per pound. Pick one item from the list each week, confirm the cause with the team (oversized batches, early cooking, spoilage or a dish guests aren't choosing), and give the change an owner.
6. Forecast vs. Actual Demand
Forecast error % = (forecast portions − portions served) ÷ portions served × 100
Every production sheet is a demand forecast. The kitchen decides how much food it will need based on expected demand, but census, occupancy, class schedules, office attendance, events and menu preferences all move the result. The goal is to make food closer to what guests will actually eat without running out.
Watch the direction of the error as well as its size. A forecast that runs high every week needs a smaller starting quantity, while one that runs low needs better replenishment, not a bigger buffer. Leave out services with stockouts, substitutions or unusual events, since those don't show true demand.
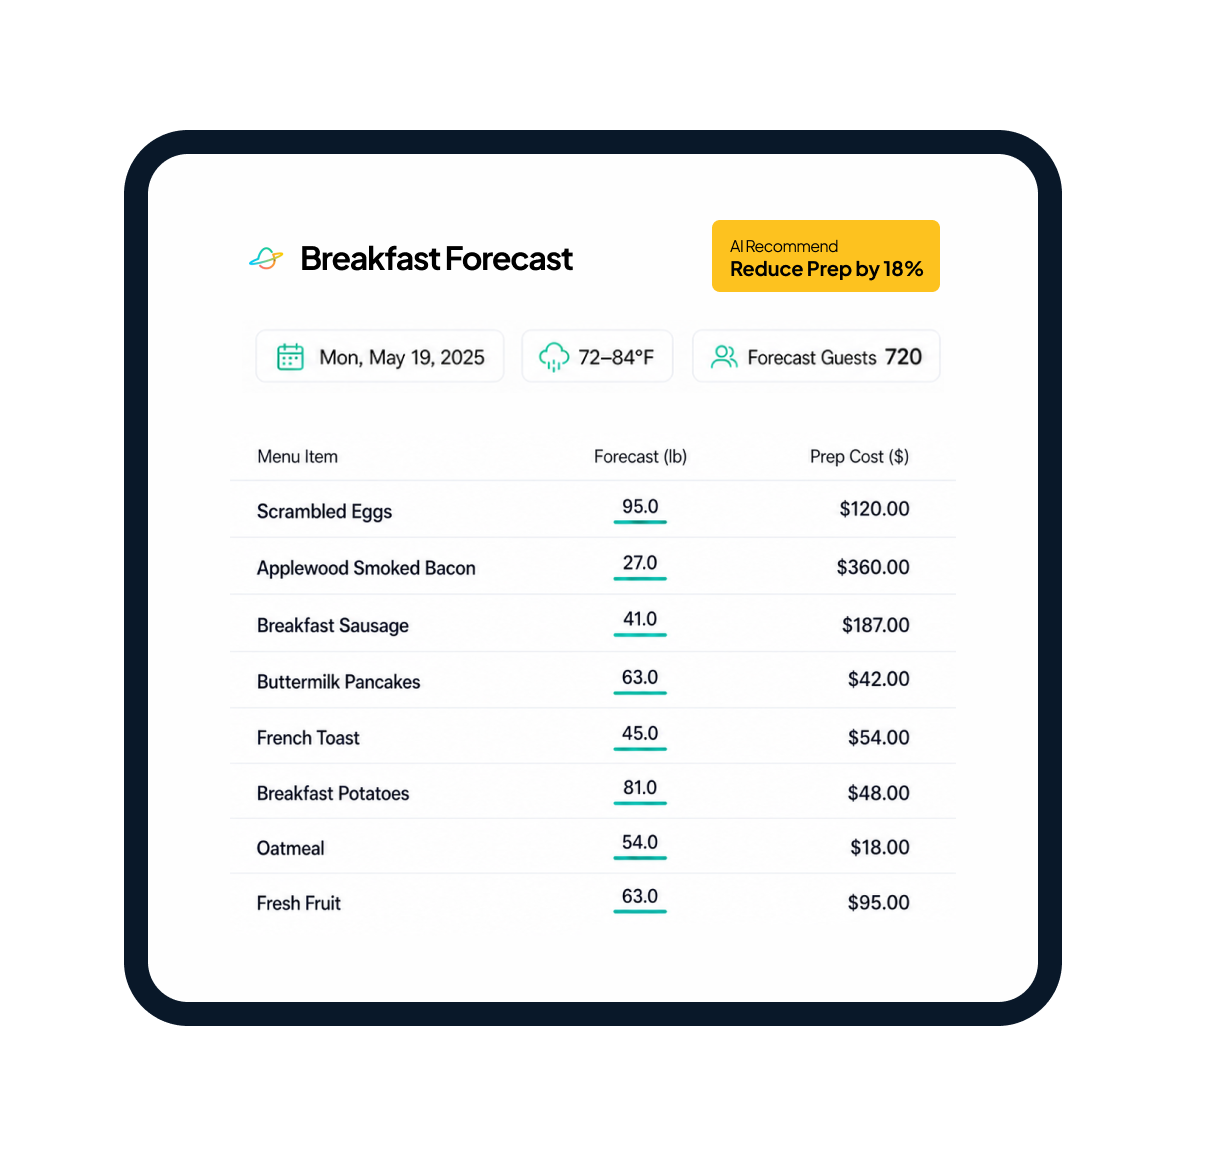
For how forecasts are built, see AI Food Demand Forecasting: How Commercial Kitchens Reduce Overproduction.
7. Verified Savings After Program Costs
Net savings = verified gross savings − total program costs
Net ROI % = net savings ÷ total program costs × 100
The value of food the kitchen didn't overproduce is a useful operating number, but it becomes savings only when purchasing and inventory records show the kitchen actually spent less.
Count software, equipment, setup and any added staff time in program costs. Count labor savings only when paid hours really change. Our guide to verifying food waste tracking savings and net ROI walks through the full check.
Run a 20-Minute Weekly Production Planning Review
Bring the chef, production lead and manager together with one consistent reporting period. Check scan coverage and covers first, so you know the numbers are complete.
Then look at the three costliest recurring overproduced items, choose one production change and name who owns it. At the next review, check the same item's leftovers, run-outs and guest feedback against comparable services.
The KPIs point to different fixes:
- High unserved food, low plate waste: usually batch size or timing.
- Low unserved food, high plate waste: portions or recipe acceptance.
- Low on both, with frequent run-outs: the plan or replenishment is too tight.
Metafoodx records food before service and again when leftovers return, so production, consumption and overproduction show up by menu item without cooks logging everything by hand. The weekly report arrives automatically.
Some KPIs also need guest counts, recipe costs or purchasing records from your own systems, so plan which reports come from where before you start. The goal is simple: find what keeps coming back and make less of it.
Frequently Asked Questions
What metrics should an executive chef track?
Along with food cost, labor and covers, chefs should track production versus food served, unserved food (overproduction), plate waste, discarded food cost per guest, the highest-cost overproduced items, forecast accuracy and verified savings. Together they show whether the kitchen is making the right amount of food for actual demand.
How do commercial kitchens measure overproduction?
Compare what was produced with what was served, by menu item. Recording food before service and again when leftovers return shows overproduction item by item, instead of a single total of pounds wasted.
Can tracking food waste reduce overproduction?
Yes, when the kitchen uses the data to change production. At UMass Amherst's Harvest Market, the team tracked production and consumption by item with Metafoodx, and overproduction fell 51.7% over 12 weeks.
How does Metafoodx work?
Metafoodx records food in about two seconds before it goes to service and again when leftovers return. AI food recognition and weight sensing identify each item and its weight, giving the kitchen production and consumption data by menu item for forecasting and production planning.
Related reading: How Metafoodx turns kitchen data into production decisions · Why Every Commercial Kitchen Should Conduct a Daily Production Review
Metafoodx is a food operations intelligence platform that captures the food journey from prep to plate, so foodservice teams can lower food cost, produce more accurately, and prevent waste before it happens. Ready to see how we can help transform your food service operation? Book a demo with our team today.